Foundations
Agent & GPU Graphs in Practice
We log and visualise a variety of performance metrics in order to track and improve our agent-GPU coordination layer. These aid in identifying inefficiencies, identifying patterns in usage, and directing the distribution of resources.
Task Size vs Completion Time
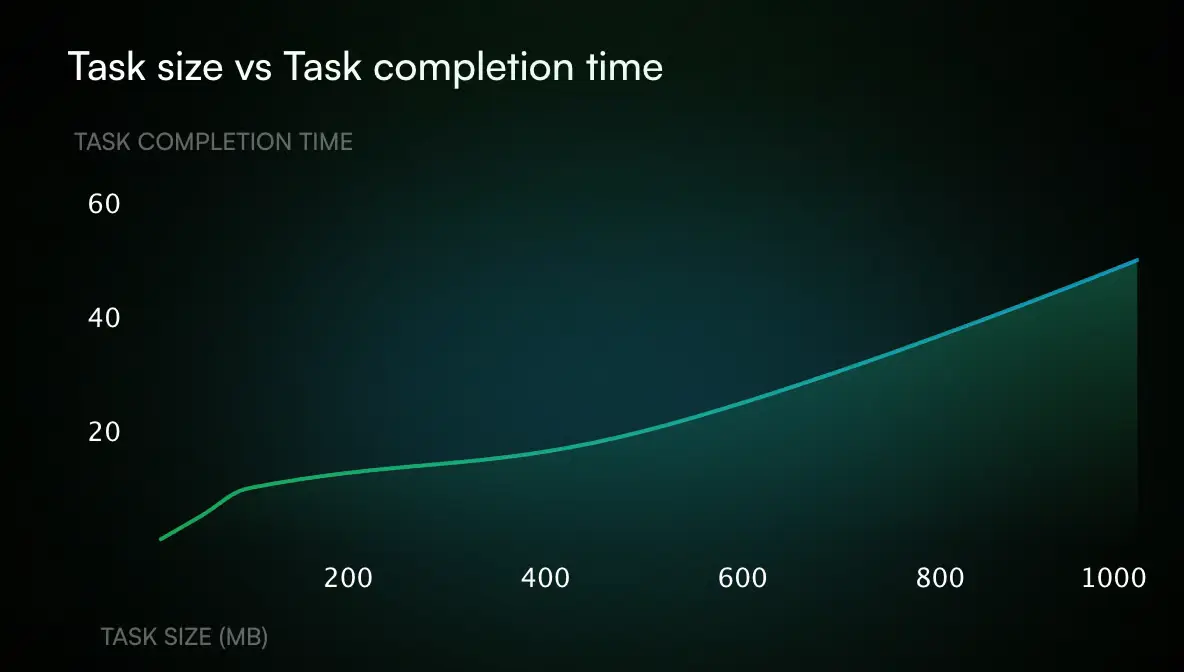
Naturally, larger tasks take longer to finish, especially when GPU memory or bandwidth limitations are present. The relationship is non-linear, as the graph illustrates: smaller tasks finish faster, but latency increases disproportionately as task size increases. This behaviour guides our dynamic scheduling, splitting, and batching of requests.
Intent Insights
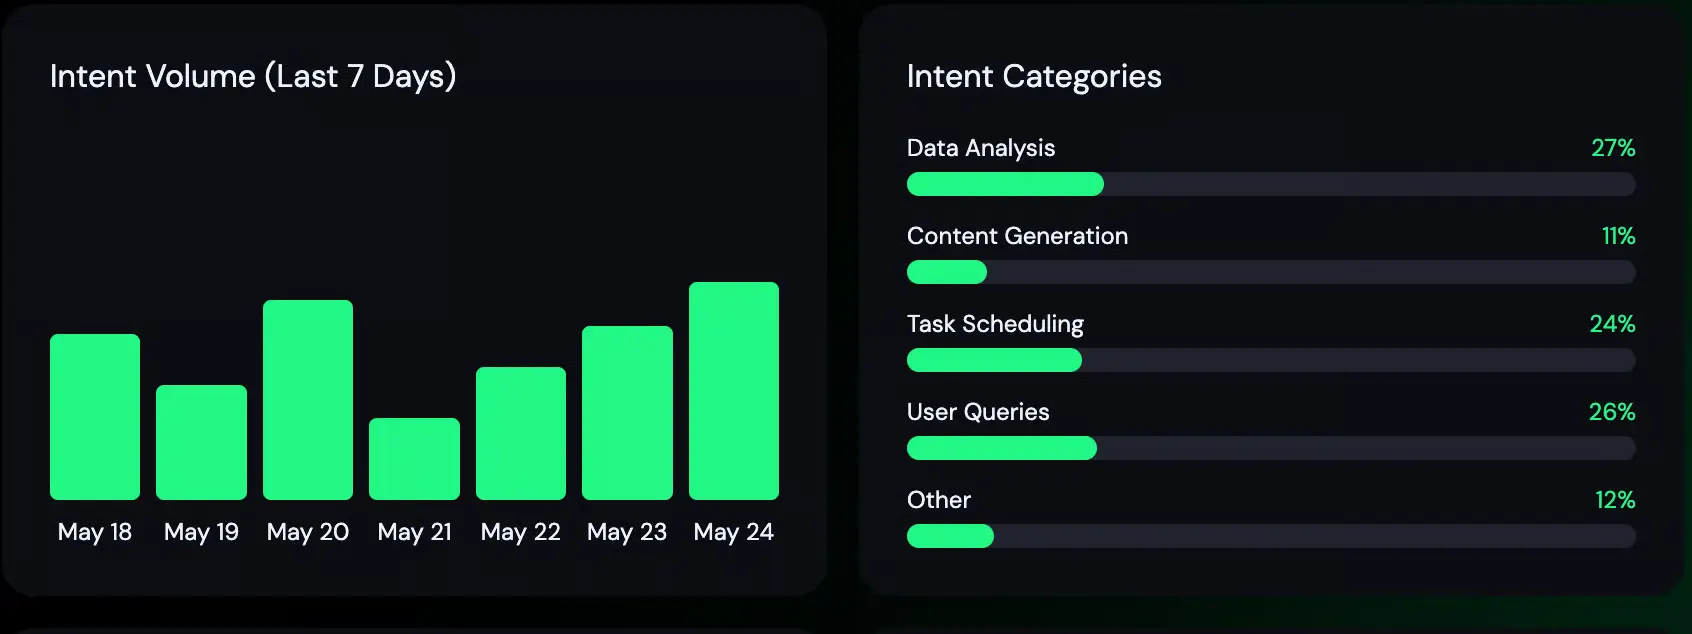
This dashboard tracks how users interact with the system.
- Intent Volume (7 Days): Shows daily task activity, helping identify peak usage patterns.
- Categories: Most intents fall under Data Analysis, Task Scheduling, and User Queries — guiding how we allocate GPU and model resources.
Node Response Variability
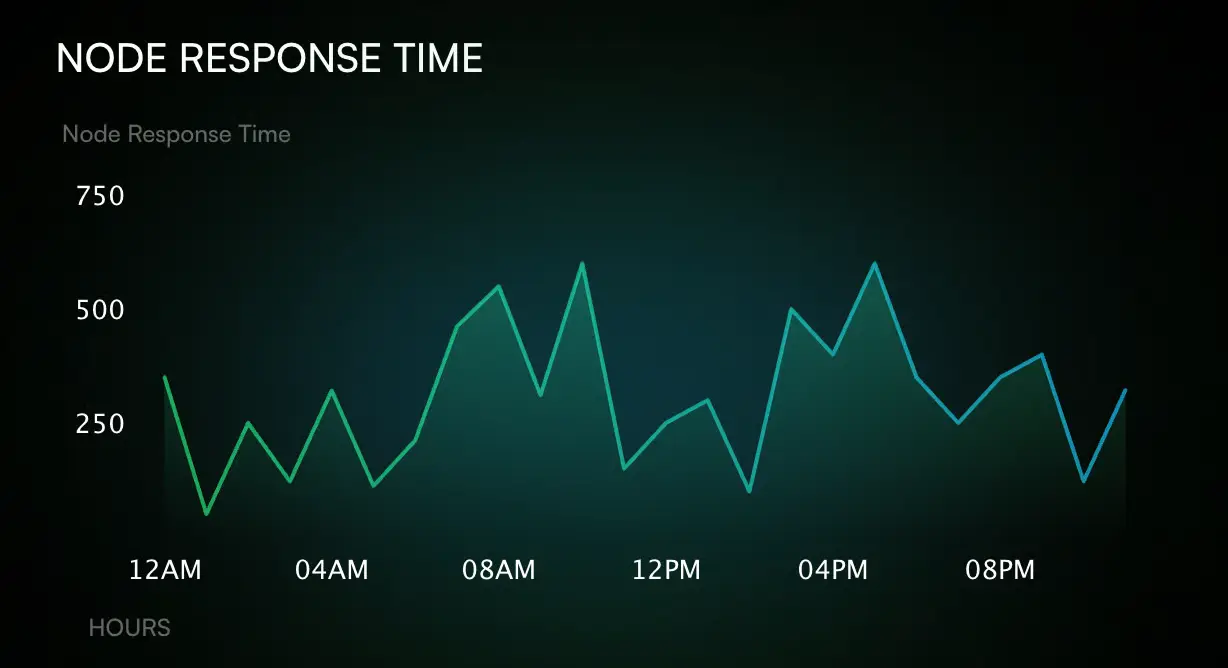
Response latency varies throughout the day for GPU nodes, particularly when they are rented or distributed. Our system uses clever queuing and rerouting techniques to detect and adjust to these variations. In order to help our compute manager optimise dispatching windows, the graph shows peaks and troughs associated with regional load or node contention.